|
This blog is an archive of outcomes from a graduate level seminar at University of California, Davis within the Earth and Planetary Sciences Department. It was formed by group of graduate students pursing questions about how we can utilize studies of the Earth's past to inform policy decisions for the future. Each week, we read and discussed 2-3 excellent papers on these topics, and have posted our findings here. We've included relevant papers, links, and interesting articles so that you can join in the fun.
For most of us, when we think about temperature and storms we think about weather. We check the weather to see if today will bring rain, snow, or sun. We may even look far ahead at a 10 day forecast or make travel plans based on seasonal expectations of weather. But, we rarely think about temperature or storm events on timescales of hundreds to thousands to millions of years. Paleoclimate studies (in particular, those that study changes in temperature over time and those that study the intensity and frequency of storms in the past) allow us to understand how these processes that affect us on a daily basis operate on longer timescales. In the face of anthropogenic climate change, it is particularly important to investigate changes in temperature and storm events in response to past climate events so that we may best predict and plan for future change (severity/magnitude, location, and frequency).
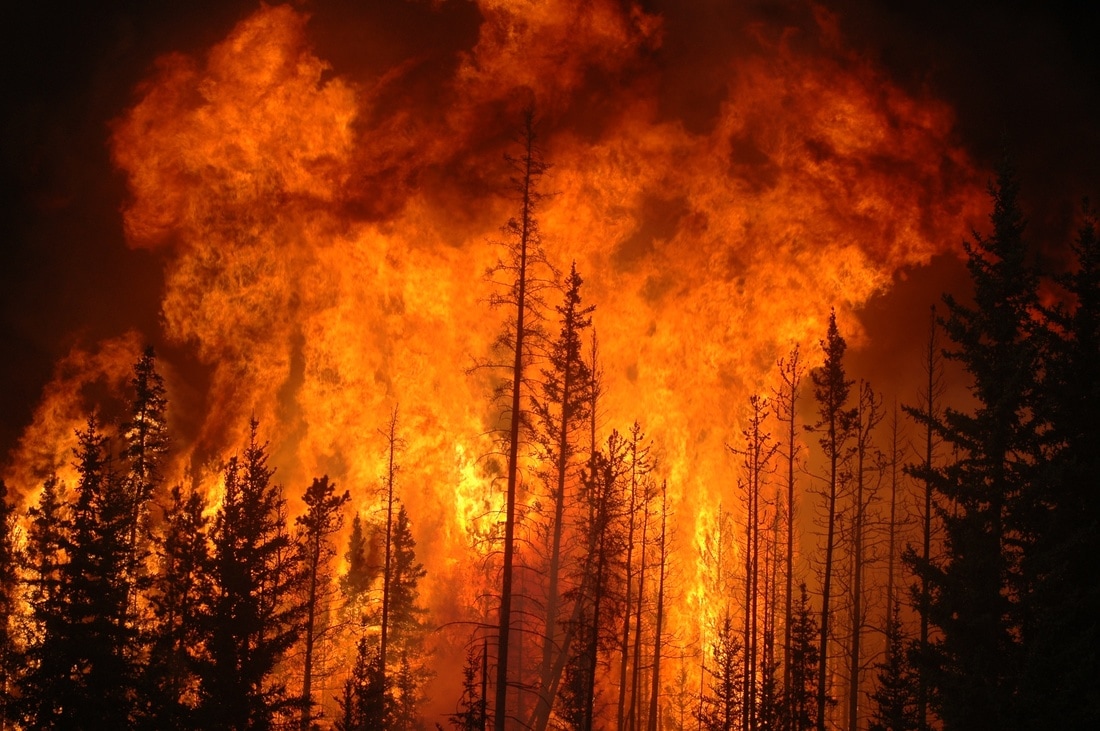 Photo: Wikimedia Commons Photo: Wikimedia Commons The occurrence and scale of major fires has been increasing worldwide over the past few decades. In 2016, nearly 565,000 acres of land burned in California alone, and US federal spending on fire suppression in California reached nearly $2 billion. Additionally, burning of forests accounts for about 12% of carbon dioxide emissions and further reduces the potential for forests to uptake carbon dioxide via photosynthesis. The world is struggling to mitigate damage from wildfires, and seemingly contradictory concerns complicate solutions. On the one hand, fire management practices should prevent fires from reaching populated areas because fires destroy infrastructure and crops and even result in loss of life. On the other hand, wildfires are a natural part of the Earth system; they cannot be perfectly contained and often serve an essential restorative function for particular ecosystems. Good fire management balances the immediate risk fires pose to humans against a better understanding of wildfire systems as a whole. A smart approach to fire management ensures that immediate suppression efforts today do not exacerbate future systems (as they did during the US Fire Suppression period from the 1920s to the 1980s). Good fire management necessitates the study of paleofire records to understand what characterizes natural cycles of wildfire and how humans are altering fire regimes. Fires leave behind evidence of their existence in the form of charcoal, the carbon-based residue of a burn. Charcoal from the distant past can be found fossilized within rocks, whereas more recent charcoal is often preserved in loose sediments. By analyzing the quantity and age of charcoal within sediment cores, we can see how fire activity has changed over time. Our class discussed two papers: Bowman et al. (2009) and Marlon et al. (2013), both of which report on fire activity throughout Earth’s history. Since large-scale fires require significant fuel on land and sufficient oxygen in the atmosphere to drive combustion, it is not surprising that fossil charcoal records indicate wildfires started soon after the emergence of terrestrial plants (~ 420 million years ago). Fire activity also depends on local climate. Despite high levels of heat and dryness, deserts tend to have insufficient vegetation for large fires, whereas the most heavily vegetated areas tend to be too humid to promote large fires. As a result, fires are most likely to occur in intermediate conditions, with savannas (e.g., US oak savannas) being ideal ecosystems. The Holocene (11,700 years ago to present) is a particularly illuminating epoch. Extensive charcoal records span this time, and scientists can compare recent fire history to known events in early human history to explore human impacts to the fire system. Several trends emerge from these data. First, human activities (i.e., the growth of organized civilizations and development of agriculture) caused minor increases in fire activity throughout the Holocene, and global and regional climate are generally the dominant drivers of fire. We know this because proxies for ocean temperature, ice sheet extent, and ENSO events are better predictors for overall fire variability than human activities. Even though humans cause about 85% of today’s wildfires, global and regional climate controls the frequency and intensity of fires. Despite improved human capacity to suppress large fires, the past couple of centuries have experienced an unprecedented rapid increase in fire activity. Yet, for the past couple of centuries, humans have been altering the climate beyond natural variation and progression. Climate change caused by increased human carbon dioxide emissions is altering global conditions in dramatic and unpredictable ways, and we are likely to see increased fire activity and damage in spite of our best efforts to take more personal responsibility and directly suppress fires. Effective fire management means not only perfecting our techniques for fighting dangerous fires, but also learning how to adapt to a new climate regime where increased fire may be unavoidable. The history of life on Earth is punctuated by mass extinctions, which are relatively sudden events in which many or even most of the planet’s species die out. Causes of mass extinctions in Earth’s past include asteroid impacts, massive volcanic eruptions, and major climatic shifts. As greater numbers of species go extinct under a human-dominated planet, an important question worth asking is whether we are currently causing a new mass extinction.
In order to understand to what degree humans drive extinction, we need to take a closer look at how different organisms adapt, evolve and recover. One way to do this is to look at the intrinsic risk of certain organisms to go extinct under “normal” environmental variations, as discussed in a paper by Finnegan et al. (2015). Intrinsic risk is calculated for a particular group of organisms (i.e., marine mammals or corals) by identifying the diversity of species in specific areas over the past 23 million years. By mapping the distribution of genera over time, scientists can identify geographic distribution of species reduction. High intrinsic risk -- or high extinction risk -- identifies areas with fauna that are strongly affected by human activity or climate change (both natural and anthropogenic). Finnegan et al. (2015) looked at intrinsic risk for six groups of marine organisms and were able to conclude that tropical areas of the Western Atlantic and Indo-Pacific have the highest intrinsic risk. This pattern is likely driven by regional, organismal requirements requiring specific habitat and food sources for survival, which makes tropical species more vulnerable to even small perturbations in their ecosystems. The Finnegan et al. (2015) study finds marine mammals, which includes dolphins, seals, whales, and others, have the highest intrinsic risk. On the one hand, this means that significant extinctions could be expected within this group even without human activity. However, their overall extinction risk is even higher with human activity, as we cause additional stressors of habitat loss, overfishing, and pollution. Mapping geographic regions with high intrinsic risk and comparing them with areas currently experiencing extreme stress from human activities, as well as areas predicted to experience dramatic effects of human-caused climate change, gives us some sense of what to expect in the near-future. For instance, the Western Atlantic is an area with high direct human impact, whereas the Indo-Pacific is especially sensitive to future climate change. Due to the high intrinsic risk in these areas, scientists expect the overall magnitude of extinction to be particularly severe. In addition to understanding extinction, the geologic record can tell us how systems recover from abrupt change. A recent study by Moffitt et al. (2015) analysed how seafloor community ecology changed in response to episodes of climate change since the Last Glacial Maximum (20,000 years ago). Surprisingly, this study found that although seafloor communities can change very rapidly (<100 years) in response to prevailing seafloor conditions, it may take a much longer time (>1000 years) for ecosystems to recover if favorable conditions return. A sobering lesson from this study is that changes humans make to our climate and environment may have quick, lasting impacts which may not be easily reversible on short timescales. Although extinctions are a part of Earth history, on human timescales they may have devastating effects on ecosystems that we depend upon for our daily lives. The papers we explored in our class show that many of the areas to be affected by anthropogenic climate change are already predisposed to experience significant extinctions, and when extinctions do happen, it can take the lifespan of many human generations for ecosystems to recover. As a result, we have to work to conserve what we can, and also begin to think of ways to respond and adapt to extinctions that are already taking place and may be unavoidable. 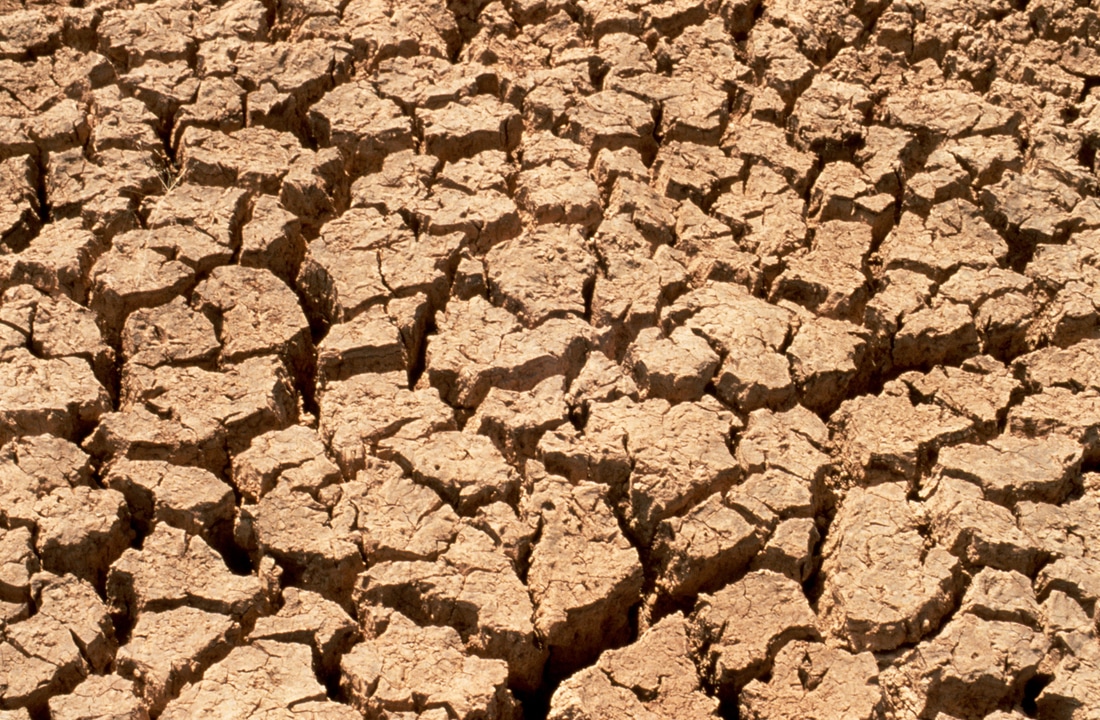 Photo: Wikimedia Commons Photo: Wikimedia Commons Hot & Dry in the Past and Present Here at UC Davis in the Central Valley of California, drought is a hot topic. In class, we discussed how the paleoclimate record can inform our understanding of patterns of drought and to place our recent droughts within the context of climate history. Furthermore, looking at droughts in the past allows us to better assess future drought risk and vulnerability. Drought is a regional phenomenon that is driven by, and linked to, global climate. Here we will explore the drought history and vulnerability of the Western United States. We focused on a paper by Cook et al. (2015) that compares historical observational records to models, in order to project future drought risk in the American Southwest and Central Plains. The Palmer Drought Severity Index (PDSI) uses temperature and precipitation data to reconstruct regional surface moisture balance. The net difference between input (precipitation) and output (evapotranspiration, i.e. the amount of water lost to the atmosphere from evaporation or transpiration by plants) provides a measure of drought. Although this model does not take into account short-term water storage like snowpack or reservoirs, it is an effective tool to model drought conditions. Cook and colleagues (2015) compare the PDSI outputs from three models to measured soil moisture at two depths (30 cm and 2 m) during the months of June, July, and August. To model future drought, the authors use projections from 17 general circulation models that use expected radiative forcing in 2100 (aka the “business as usual” level of emissions (RCP 8.5)). The PDSI, general circulation models, and expected emissions are then integrated with the North American Drought Atlas (NADA), which provides a historic record of drought during the past 1000 years based on tree ring analysis. Model outputs are then compared with model projections to forecast future drought conditions. Severe drought conditions are expected with an 80% chance of a multidecadal, or 35 year long, drought occurring before 2100. Drought has a long history of impacting civilizations, from the fall of the Old Kingdom in Ancient Egypt to the collapse of the Mayan Empire. A visual examination of the drought severity of the United States on this interactive map shows the severity of drought during the Dust Bowl, a large scale event that triggered migrations and economic depression across the US. Furthermore, new studies are pointing to drought severity as a precursor to political instability in Syria in recent years. Although drought has direct impacts on agriculture, economies, and human lives, there are many things that individuals can do to mitigate the impacts of drought. Understanding drought history and calibrating our models with historical data is important for developing water policy because it allows us to understand the natural variability within regional water systems and to better predict future extreme events. We can use paleoclimate evidence to motivate thoughtful policy on both the use and storage of water. Although our paleoclimate records rarely quantify water storage in the past, understanding the magnitude and duration of drought events can inform how much water must be stored during wet periods to plan for future drought events. By looking into the past, we are able to understand the major impacts of drought on humans and to constrain the range of variability within the hydrologic cycle. Policy and management decisions can be guided by the information from the past, yet challenges for adaptation remain. Regarding planning for drought in the Western US, Cook et al. 2015 comment “...perhaps most importantly for adaptation, recent years have witnessed the widespread depletion of nonrenewable groundwater reservoirs, resources that have allowed people to mitigate the impacts of naturally occurring droughts. In some cases, these losses have even exceeded the capacity of Lake Mead and Lake Powell, the two major surface reservoirs in the region. Combined with the likelihood of a much drier future and increased demand, the loss of groundwater and higher temperatures will likely exacerbate the impacts of future droughts, presenting a major adaptation challenge for managing ecological and anthropogenic water needs in the region.” Additional Resources: What is the PDSI? Wired Article on California Drought Journal article on links between drought and present conflict in Syria Interactive map of drought history in US Model projections of future drought New York Times article on CA drought Links between drought and human civilizations Tips for water saving Conservation Paleoecology: Utilizing records of past ecosystems to inform modern management6/14/2017
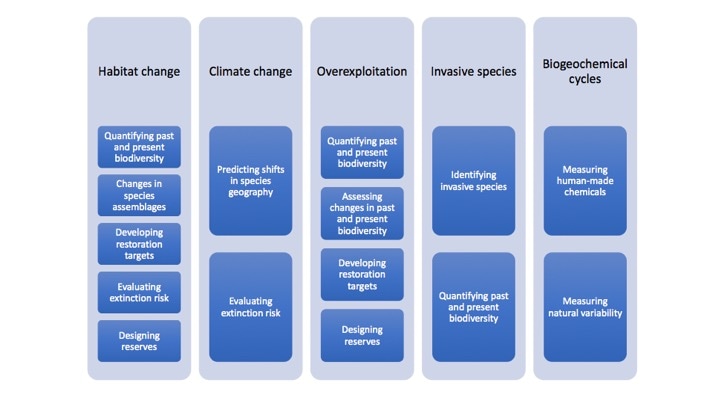
Scientists can study the fossil record to learn about past ecosystems and to better inform decisions about management for the future. Conservation paleobiology is an emerging field that integrates paleontological data with current data in order to better understand how ecosystems change, including how they respond to human impacts. Paleobiological data are useful for defining the range of natural variability within ecosystems that existed prior to widespread human activity. We explored several drivers of ecosystem change and the ways in which conservation paleobiology can be utilized in understanding and responding to these changes. This week we explored the utility of conservation palaeobiology by focusing on a paper by Dietl et al. 2015 that outlines five processes that affect ecosystems and can be studied within the paleoecological record: habitat change, climate change, overexploitation, invasive species, and biogeochemical changes. For modern ecologists, it can be incredibly expensive and logistically challenging to conduct large studies for any period of time lasting longer than a year. Most graduate programs are only 4-6 years, and most grant cycles for research funds are 2-5 years with few exceptions. The palaeontological record therefore offers the advantage of observing ecosystems across longer time scales, including:
Another strength of accessing the paleontological record is that it allows for comparison with the rare but powerful long-term monitoring studies conducted by modern ecologists to put the observation of current changes in context. Furthermore, integrating paleoecological studies with studies of paleoclimate and paleoceanography (like those discussed in our other blog posts!) gives us context for the magnitude and rate of change occurring in modern ecological and climate systems. The fossil record can help us understand the timing of events, including biotic changes (e.g. the spread of invasive species), as well as abiotic factors (e.g. volcanic eruptions and gas emissions). The examination of past environmental change also allows us to separate “natural” states of climate change from human-induced environmental changes (e.g. past ocean acidification events are usually much slower than today). We developed the chart below to summarize our discussions of how studying ecosystem processes through the lens of paleoecology and paleoclimate can produce deliverable results that inform policy and management. The columns represent the major processes driving modern ecosystem change as defined by Dietl et al. 2015, and the blue boxes list the ways in which understanding these processes through the lens of paleoecology can be utilized to inform policy. To further explore this topic and to see specific examples of how paleoecological studies can provide management deliverables, see Dietl et al. 2015. To understand how long term, geologic information might be incorporated into marine conservation and management, we contacted Cyndi Dawson, at the California Ocean Protection Council, who noted, “Understanding both our recent and far past gives us the ability to understand current changes in context. We can see that the rate and magnitude of some changes we are seeing now is very different than what we have seen before. This can help us understand the drivers of change and allow us to think about ways to create informed policy that can help mitigate negative impacts to our environment.“
Past environmental change, based on Earth’s natural variability, can inform scientists how humans have influenced climate and the environment on a global scale. One of the most well-publicized facets of human-induced climate change is the release of carbon dioxide into the atmosphere, which has sharply increased since the Industrial Revolution. Only within the last decade have scientists begun to characterize the ecological consequences of increased carbon dioxide absorption by the oceans.
When carbon dioxide from the atmosphere dissolves in the oceans, a number of chemical changes occur and seawater becomes more acidic. This process is called ocean acidification (OA). This shift creates conditions that make it difficult for marine animals with shells (e.g. corals, clams, oysters, and snails) to build their skeletons. While there are many studies that demonstrate the negative effects of ocean acidification on individual species, it is much more difficult, time consuming, and costly to conduct experiments on an entire marine ecosystem scale. However, we can look to the past: the fossil record serves as an ideal natural laboratory for studying large-scale impacts of ocean acidification on ecosystems over time. Our class read a paper on ocean acidification events through geologic time (Hönisch et al. 2012). The authors review several important concepts to contextualize modern ocean acidification in the frame of past acidification events (within the last ~300 million years). The authors highlight that the rate of change of 1) carbon dioxide uptake by the ocean, 2) decrease in seawater pH (how acidic a solution is, with a low pH being high acidity), and 3) saturation of calcium carbonate (a key indicator of the ability of organisms to make shells) must be fairly rapid to produce a rapid acidification event (10,000 years or less). Signs of biotic change and distress during past acidification events includes thinner or deformed shells, which scientists can use to understand how animals reacted to these changes. We identified two key concepts that highlight the significance of past ocean acidification for informing policy:
Understanding past acidification events allows scientists to better understand how ecosystems and organism might be most vulnerable to present changes. The most analogous past OA event (the PETM) shows that this rapid influx will damage coral reef ecosystems amongst other carbonate dependent species like oysters, clams, and mussels. While many ocean parameters are changing at once (like oxygen, temperature, and OA), Hönisch et al. (2012) argue that isolating the distinct contributions of ocean acidification may not be necessary since the parameters are not independent. Instead, they argue that the integrated nature of large carbon releases and associated warming temperatures is actually a strength for investigating ocean acidification in the fossil record. Using the paleo record to predict ecosystem changes, whether from OA or not, is important to managing our calcareous resources (shellfish and corals). To address how this information can be used in the policy and management realm, we contacted Jennifer Phillips at the California Ocean Protection Council, who noted: “Using the paleo record to show impacts from ocean acidification can be a powerful tool for highlighting how important it is to act swiftly on ocean acidification - especially when considering we don’t have a historical analog that is as matched as the present day rate of change of our ocean’s chemistry. Given the rate of CO2 emissions, we can’t look at ocean acidification independent of other changes in our oceans due to the increased uptake of greenhouse gases so it is important to look at historical scenarios of coupled changes. As a policymaker, I must address ocean acidification changes in tandem with other changes which is a critical and urgent challenge for our community.“ Human activity can fundamentally alter the chemistry of the oceans, including how much oxygen is dissolved within the oceans. In fact, studies show that global ocean oxygen levels have dropped dramatically in the past 50 years and are to likely to continue to do so. What does this mean for the ecosystems we rely on? Understanding ocean oxygenation over time is critical because oxygen is important for organisms big and small, from large marine mammals to fish harvested for human consumption to the microscopic organisms that form the base of marine food webs. It is important to extend records of ocean oxygenation into the distant past in order to understand potential changes in the future. This week our group discussed on a paper on utilizing ocean oxygen history as a lesson for the future. We focused on 1) what factors affect ocean oxygenation, 2) what tools are used to study oxygen in the past, 3) how oxygen has changed over the last 20,000 years, and 4) how this information can help scientists predict future changes in ocean oxygenation.
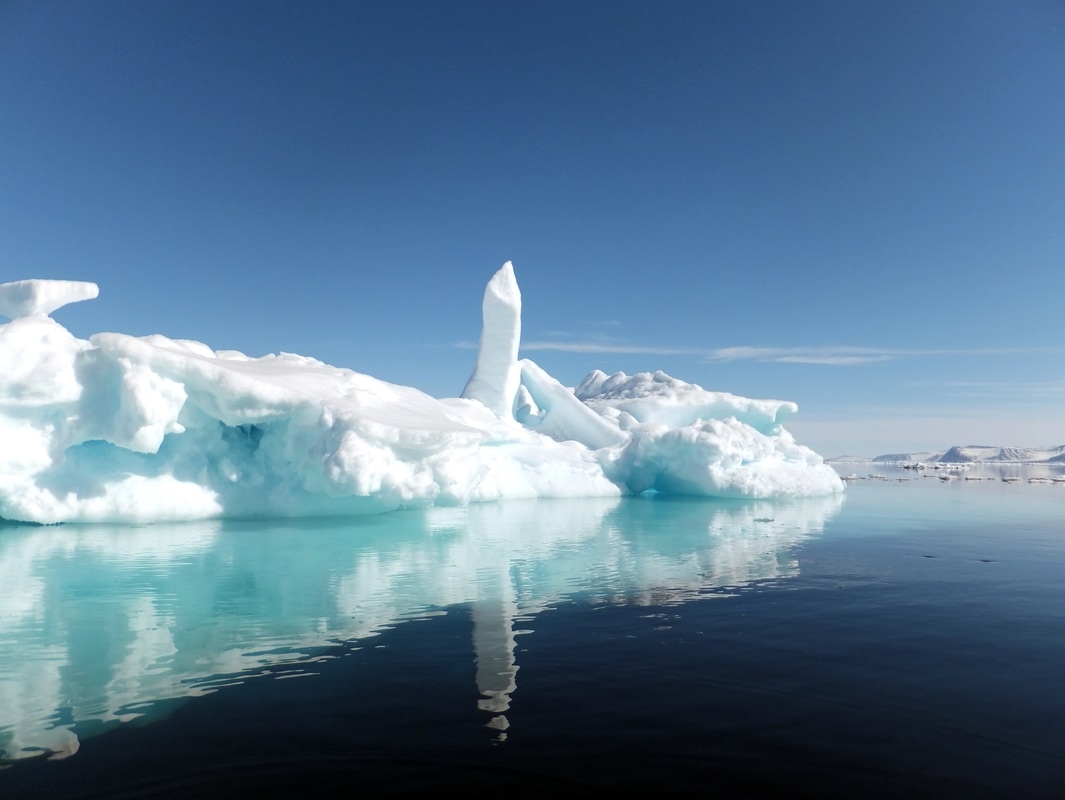 Arctic sea ice (Wikimedia Commons) Arctic sea ice (Wikimedia Commons) When thinking about the Arctic, the picture that often comes to mind is an ice-covered ocean that grows and shrinks seasonally. In the Arctic region, the majority of the ice is sea ice, meaning that it floats directly on the seawater. Sea ice is less stable than land ice, resulting in the Arctic being very sensitive to climatic changes. To better anticipate future changes in this region, it is essential to improve understanding of how the Arctic has responded to climate change in the past. Currently available research can provide an estimate of historical sea ice extent that is instructive for both its description of past change, but also from a methodological standpoint by providing a robust, rigorous use of multiple proxies for past change. To understand how information like this might be used by decision makers, we contacted Dr. Whit Saumweber at the Center for Ocean Solutions, who noted that “improving public understanding of how these proxies are developed, and the rigor with which they are applied can help to increase public confidence in our understanding of climate impacts.” Our class discussed a 2010 paper by Leonid Polyak and colleagues, which describes a suite of evidence scientists use to determine when and where ice was present. Sediment cores drilled from the floor of the Arctic Ocean can be very illuminating, especially for capturing the oldest records of Arctic ice (50 million years ago). The size of sand, silt, and mud preserved on the ocean floor, as well as the type and chemistry of fossils, give researchers some indication of whether ice was covering the ocean at a particular time. However, modern sea ice cover makes these records difficult to obtain. Therefore, scientists often use more readily available lines of evidence that can be found in coastal areas around the Arctic, including the presence of driftwood and whalebones. Driftwood deposited during the past will only appear on ice-free coasts close to the edges of Arctic sea ice. The presence of wood (age dated using radiocarbon) on a coast indicates that Arctic ice extended to that point at the time the driftwood was deposited. Similarly, locations of ancient whalebones provides information on the extent of past ice as bowhead whales live near the margins of Arctic sea ice, but cannot cross large expanses of sea ice. During time periods in the past that Pacific and Atlantic bowheads were found together, scientists know the Arctic was ice-free at least for part of the summer, otherwise these animals would not have been able to cross the Arctic to coexist. Each piece of evidence only gives a portion of the record, but when combined they can tell us about the history of Arctic sea ice. Together, chemical and biological indicators in the sediment record (including sediments and microfossils) provide evidence for less Arctic sea ice at the beginning of the Holocene Epoch (~10,000 years ago). This conclusion is further supported by the scarcity of driftwood during this time, as well as the intermingling of Pacific and Atlantic bowhead whale bones. The full range of evidence shows progressive growth of sea ice through much of the Holocene (past 10,000 years), which is consistent with known cooling caused by an overall decrease in solar intensity. One exciting aspect of this paper is that it blends together many different lines of evidence to build a picture of past sea ice variability that is quite rigorously supported. About this research, Dr. Whit Saumweber added that “research such as that conducted by Polyak et. al. is incredibly useful for helping us contextualize both the scope and rate of change that the Arctic is facing. Their record historical sea ice extent forces us to recognize the unprecedented nature of this change and is helping to marshal an appropriate scale of international response to the climate crisis. In addition, many of the proxies they used to develop the sea ice record can themselves be useful for understanding ecosystem response to the radical change we are facing. This information in turn can be used to help communities that rely on these ecosystems prepare and adapt.” Along these lines, there are close linkages between changes in Arctic sea ice cover and ecosystems, specifically via types of marine species have been able to live in the Arctic or use it as a conduit to pass between the Pacific and Atlantic Oceans (e.g., Renaud et al., 2015). The paper by Renaud and colleagues documents that the Bering Strait opened between North America and Eurasia between 3 and 4 million years ago (m.y.a) during a period of increased temperature and sea ice melting called the mid-Pliocene warm period. This event allowed taxa from the North Pacific to expand into the Arctic and the Atlantic Ocean, and vice versa. After the opening of the Bering Strait and subsequent animal migrations, the global climate cooled significantly approximately 3 m.y.a. and initiated the formation of the Arctic ice sheet. Colder temperatures and presence of sea ice caused geographic isolation between the Pacific and Atlantic oceans and only animals that were able to adapt to extreme cold conditions could survive in the Arctic itself. The geologic record of ice variability in the Arctic clearly demonstrates that the the modern rapid ice loss over the past century does not fit with historical patterns over the past 10,000 years. Now that temperatures are rising and Arctic sea ice coverage is decreasing, animals in the Pacific and Atlantic will once again be able to move northwards and intermingle. Increasing temperatures will largely affect shallow water fauna and those that live where deep water masses are exchanged with warmer surface water. The ability of animals to migrate, invade new ecosystems, and adapt to environmental change very over short timescales will depend very much on the changes of the physical environment in addition to the life history and temperature tolerances of each individual species. For example, animals that swim freely in the water column (as opposed to those that live on the sea floor) will have a greater ability to migrate north because surface waters are expected to warm more quickly than bottom waters. But what does this mean for incumbents of the Arctic? Not only will polar animals face potential challenges dealing with higher temperatures, they will also have to adjust to competition from invaders coming from warmer waters. In addition, the Arctic may experience changes in primary productivity as sea ice thins and light availability changes in this region. It is important to think about the changes occurring in the Arctic today in the context of those that have occurred in the past. From the past, we develop an understanding of how sea ice has changed previously and how ecosystems have responded, which enables a clearer picture of what our future Arctic may look like. Sea level rise is one of the many consequences of global climate change. Many coastal cities and island regions at or near sea level face an imminent threat from sea level rise (SLR) within the next century. The number of people affected by sea level rise is only expected to increase as coastal erosion, high tides, and flooding affect infrastructure in coastal areas. Investigating sea level changes in the past will provide a better understanding of future sea level rise and associated threats initiated by climate change. When we contacted Christina Toms, Senior Environmental Scientist with the SF Bay Regional Water Quality Control Board, she noted that “...much of the damage from sea level rise will come before long-term sea level rises above a particular threshold; it will instead come from episodic, localized increases due to (more intense) storms/waves on top of elevated sea level baselines.” This damage will include flooding during “king tides” and storm surge, which will increase in impact and severity as overall sea levels increase.
Our class discussed a 2009 paper by Dr. Glenn Milne and colleagues that outlines the causes of sea level rise and the evidence used to reconstruct how sea level has changed in the past. Records of past sea level include: changes in oxygen isotopes in fossil corals and other animals, variations in patterns of fossil deposition, coastal archeological studies, and evidence provided by wave cut terraces. Glacial ice tends to have a different oxygen isotope values compared to seawater. As a result, when glaciers melt and contribute to higher sea level, the isotopic signature of seawater will change. This in turn is preserved in the shells of microscopic organisms and corals, and these recorded signatures have been changing over the past 20,000 years. For example, records from the Sunda continental shelf in Southeast Asia show changes are consistent with sea level rise between 21,000 and 14,000 years ago. In more recent times, the placement of ancient Roman fisheries relative to modern sea level shows sea level rise along the Mediterranean coast over the past 2,000 years. However, this change is not considered globally significant when isostatic factors (discussed below) are taken into consideration. The class also discussed the many long- and short-term geologic processes that affect sea level rise. In the short-term, melting ice on land and thermal expansion of existing water are the major drivers of this phenomenon. When land ice melts, it flows into the oceans, adding water (thus more volume) to the ocean basins. Additionally, temperature influences fluid density: warmer temperatures cause fluids to expand and colder temperatures cause fluids to contract. Warmer, less dense, ocean water experiences thermal expansion (warmer water occupies more space), thus contributing to sea level rise, for example during the most recent ‘warm blob’ oceanographic conditions in the past several years. “[tide] gauge data from the summer of 2015 provided a remarkable window into what future sea level rise might look like in the [San Francisco] Bay, and especially how it would impact ecosystems and localized flooding,” says Christina Toms. Some of the long-term geologic processes that affect sea level rise are the movement of tectonic plates and glacial isostatic rebound. In areas near the location of the melting ice sheets, sea level fall has often been observed as a result of glacial isostatic rebound. Glacial isostatic rebound is the rise of land masses that were previously weighed down by large ice sheets. For a point of comparison, think of how an inflatable raft sits lower in the water when people are using it, but pops back up when weight is removed. A similar situation occurs with continents: when land masses are covered with ice, they sit lower in the mantle (an interior layer of the Earth that acts as a liquid). When ice is removed (melts), continents will pop up, or rebound, to float at a higher point in the mantle. Even though the amount of seawater is increasing because of the melting of land ice, sea level local to the glacier may stay the same because the entire land mass is gaining elevation. Land masses not experiencing isostatic rebound may experience sea level rise and higher erosion rates. Additionally, variations in Earth’s gravity over geologic timescales can also affect global sea levels. During a period of weaker gravitational forces, gravity will exert less force on the oceans, which will decrease the pressure on the water column and encourage more water to pool locally. To measure present-day sea level rise, we use satellite technology (OSTM/JASON-2; GRACE), buoys (the Argo network), and tidal gauges monitored by the USGS and NOAA. In general, sea levels are rising; average global sea level has been rising over the past millennia due to long term geologic processes, but at a much faster rate over the past few decades. Some reef islands in the Solomon Islands have already been lost to a combination of sea level rise and erosion due to rising ocean levels. Islands in Alaska and the Gulf Coast of Louisiana, as well as communities in Virginia and Florida are just a few more examples of coastal communities that are already dealing with changes in sea level, and California has issued a new report on the rapidly growing evidence and knowledge about how this process will impact the CA coast. Taken together, knowledge of modern sea level rise and archives of past change allow us to understand sea level change on a range of timescales, future risks and potential management and mitigation tactics. For more information: Video on NASA sea level research California OPC report on sea level A UCD student blog post on sea level Written by the members of UC Davis GEL 232: K. Barclay, R. Banker, P. Edwards, C. Fish, K. Hewett, T. Hill, G. Hollyday, C. Livsey, H. Palmer, P. Shukla, D. Vasey. |
ArchiveSea Levels: Past, Present and Future
How has El Niño changed in the past? Lessons from paleoclimate archives Paleoclimate into Policy: is there a bright future for learning from the past AuthorsWritten by the members of UC Davis GEL 232: K. Barclay, R. Banker, P. Edwards, C. Fish, K. Hewett, T. Hill, G. Hollyday, C. Livsey, H. Palmer, P. Shukla, D. Vasey. Categories
All
|
